“Back in the Day”, I enjoyed wit of the following Geico caveman commercial.
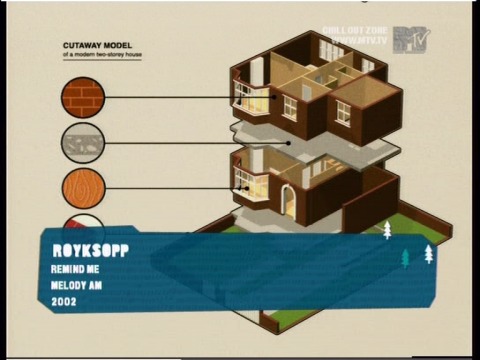
The old school monitor and tennis racket were spot on (and technological changes are evident even in staged props!) I found the song, performed by Royksopp, to be the real star of the commerical. And the song’s music video, which followed the day in the life of his love in London, was a data geek’s dream.
What caught my attention was the extensive use of infographics, schematics, and other information visualization techniques. In many ways, these infographics only matter when put into context of the singer’s desire to be with her. That desire of “wanting to know” is universal but not always easy to act upon to one’s satisfaction. In this case, the singer must return to London to know fully what his love is doing and to participate in a more emotionally fulfilling manner with her. As the singer says in the song, he is “reminded” of things that are connected to his memories of his love (the same thought as in “Always Something There to Remind Me”).
When I watched the video, I compared how much more data are collected today than twenty years ago when the video was first released. The Internet of Things, driven by the need for people to have more information (and by expectation control) of the world around them, generated a stream of details. But not all information is usable or actionable for me. For example, some of the video’s graphics, such as traveler destinations when exiting the train, sewer water capacity, milk production, etc., are very specific for someone to know, but not me. In reality, I don’t need to know the name of the train driver, unless a need exists to tie my trip to a specific train (such as recover a lost item). That reflects the real challenge: we can present information in novel ways, making the complex simple, for people who really want to know the information?
Today, we possess more robust/detailed data than twenty years ago, but the same need to communicate effectively exists. The reality is that possessing more information may not change how we perceive the world, as this information requires balancing other concerns (food, shelter, job, etc.). For example, Suzie and I visited Crater Lake in 2015. I did not need to understand the Lake’s depth, how it was formed, etc., to enjoy the view, but I am sure there are plenty of geologists, biologists, etc., who monitor the lake’s every detail.
As we collectively capture data and process this information into digestible chunks, we must balance acquiring more information in the context of other goals. Thus, a music video full of infographics highlights the isolation that knowing data, but forgetting the relationships, can make one feel alone, as lamented by the singer. And loneliness is something even a caveman can understand.