Skip to content

Random Thoughts from A Random Mind

A place to post my digital debris, ranging on topics ranging from writing a dissertation, economics, transportation, data/analysis, martial arts, and whatever else "floats my boat".

  • About and Disclaimer

Category: metadata

Posted on January 13, 2022January 18, 2022

How Big A Collection Does One Need?

loose change

Coins, while a medium of exchange, can also be an object of beauty. 

 My Uncle Tom Cooper was an avid coin collector.  He imparted an interest in coin collecting to myself and my bother when we were young boys.  Uncle Tom focused on the usual things, mint sets, dollar serial sheets, historical coins, eventually assessing quite a nice collection.  My brother renewed my interest in coin collecting with the “America the Beautiful” quarter series. When combined with my spare change from various international trips, I am technically a “coin collector”.  (You can’t spend coins from other countries in the U.S., such as my few pre-Euro French Francs, etc., so there is nothing to do but keep them in a bag!)  But my effort pales when compared to my Uncle’s collection. 

There seems to be no answer regarding how many coin collectors exist.  Someone who collects bicentennial quarters or wheat pennies enjoys coin collection.  One could argue that anyone with change in their pockets, a jar by the laundry, etc., becomes a coin collector.  A collector’s goals could include storing coins found in spare change to acquiring historical, rare, or valuable coins.  In all cases, the collector receives some value beyond the collection’s value, such as learning about the desired objects or enjoying its intrinsic beauty.  (To the data scientist, would this be considered metadata?) 

So the question remains: what makes a collection, including how to value it or determine its minimum size? In all cases, it is not the number of objects that makes something a group, but rather the owner’s interest that genuinely creates value. That is why I was fascinated by the following story (Escape Pod 746: The ’76 Goldwater Dime). The protagonist’s connection is smaller than mine, but he struggles with anyone believing his collection’s validity. He perceives his collection has value but questions if others would share his interest or understand the collection itself.  But ultimately, he is happy with his collection, regardless of what others believe.

This led me to consider the following graphic: how big does a collection need to be?  For example, the world is full of collectables, such as coins, but also books, dolls, bicycles, etc.  There is no end to what one may collect, however both time and money, as well as our interest, limit us to consider what we will collect.  Furthermore, we are limited to what we wish to collect by considerations of acquisition, storage, etc., unless of course we become the stereotypical hoarders.

As an economist, I believe people are happiness-seeking creatures, so any collection (that is legal, etc.) becomes a good thing, regardless of the collection’s size or market value.  For if beauty exists in the eye of the beholder, the creation of beauty benefits us all. 
Posted on August 4, 2019

Why Learning to “Question The Question” Matters

Photo by Diego PH on Unsplash

Edit

As a young researcher working at the Port of Long Beach, I answered requests generated from the port staff. (As my time in Long Beach occurred before the Internet became the “knowledge search tool”, I had to understand what people needed and why they needed the information!) After plenty of, “This is not what I need”, “I wanted it like the report you did a year ago”, “how much do you spend on data purchases”, I realized that it was not only understanding their “question”, but knowing what intelligence they needed. So, I asked questions about their request (sometimes the light bulb takes a while to come on…). Surprising, once I took the time to question the requester, the better the research (more timely, focused, etc.) became. (There was a great discussion on the importance of questions by Hal Gregersen on “The One You Feed” Podcast.)

Disclaimer: The following assumes these are internally generated questions. While the same approach could be used for evaluating service consulting requests, there exist other program elements one would add beyond these questions.

The questions fall into four broad categories: Institutional, Skills, Costs, and Review. The Institutional category links the inquiry to the organization’s goals and values. One could argue these are the most important to know, for they outline what is expected, but I would argue they are not the only thing to assess. The Skills category is a self-determination about your ability to provide the answer, while Costs outline what (if any) additional resources may be needed. Finally, the last category is Review, i.e., what can I do better/different in my current work activities based on this request. (Rearranging the 4 categories results in RISC, an appropriate reminder of the possible consequences of bad/misinformed research.)

Institutional: The objective is to provide timely intelligence to support the organization’s mission. In many ways, knowing the right answer but for the wrong question does not help anyone, and researchers must guard against our own biases concerning what we think someone needs. I had to learn to ask the following questions:

  • Who needs this,
  • Who asked the question,
  • When do they expect an answer,
  • What are their expected outcomes (and by when),
  • Can you repeat their inquiry back to them in a clear, concise manner,
  • Will this require an internal review, and if so, who would do that work,
  • Will this intelligence be used internally or externally,
  • Who will review this work,
  • How important is this request when compared to other requests,
  • Into what format do you want the report (chart, text, etc.)
  • Is this question related to some legal request, requiring documentation, or following specific guidance goal,
  • While this require a presentation/training on my part when completed,
  • What level of confidence are they willing to accept, which can range from a rough guess to a high degree of confidence?

Skills: In many ways, this is the hardest category to consider, for one must be honest. Without this assessment, the researcher may needlessly expose themselves to having their work deemed less than acceptable over time. Some questions may include:

  • Do I have the time,
  • Do I have access to the data to complete the task,
  • Do I have the software/skills to complete the task,
  • Do I want to do this research,
  • What happens if I don’t do this,
  • Is this like previous questions I (or others) have answered in the past,
  • Can you repeat their inquiry back to them in a clear, concise manner,
  • Can someone else answer this question better than me,
  • Do I have the domain knowledge to understand the topic,
  • Do I need a collaborator,
  • Do I need some training to answer this question?

Costs: Sometimes there are costs associated with doing business researcher. Not all data is accessible in the format one needs, nor, as people believe is all information “free” on the internet. The researcher must understand the resource costs, but these may matter little to the person who generated the inquiry!

  • Do I need to purchase data/information services,
  • Do I need to get a license or right to access the data,
  • Do I need to purchase software or hardware,
  • Do I need to hire a consultant because I do not have the skills time or energy to complete this project is anticipated format,
  • Can I legally share this data, or does it have to be summarized, etc.?
  • Do I need to pay for training to respond to this request?

Review: After the work is delivered, sometimes it is helpful to review with the inquirer to understand how your research met their needs. And for any professional researcher, this is an ongoing query regarding “do I have the right knowledge to do my appointed tasks”. These questions may include discussions such as:

  • Will I be asked similar questions in the future,
  • Do you want to yourself/others to access this information directly without asking me,
  • Do you need training to access the data themselves,
  • Do you or I need more domain knowledge,
  • Did the information satisfy our organization’s needs?

So, what did I do once I better understood internal needs?

After a while, I started to see where most questions centered around “who was doing what where” and “were they successful”. Knowing most questions focused on certain topics, it was easy incorporate those queries into my ongoing data/market research activities. Ultimately, this lead to the development of the Port’s first maritime data mart by integrating PIERS into Oracle with many long-forgotten programs (such as Paradox and Brio). The datamart, using various scripts, generated quarterly market reports for Senior Staff. The information also provided specialized research studies for current or potential clients of the port concerning market patterns.

But people do not “understand the value of information”, something every researcher laments. When I was at the Port of Long Beach, Don Wylie, my boss, instructed me to include on every report “the data was developed by the Trade and Maritime Services using PIERS data”. The following year, there was no debate concerning renewing the PIERS data purchase, nor the value that the Trade Office provided.

In sum, asking the right questions, through a structured approach, can illuminate everyone’s expectations. This should result in more successful projects, while demonstrating the value of a robust internal research mission.

Posted on June 20, 2019September 14, 2021

The Master of Your Domain

We talk about others being a legend in their own mind, although we like to think we are “Masters of Our Domain”. When it comes to data and analysis, that domain may not be a physical space, but the information and intelligence one manages/controls. For example, my background has focused on ports, transportation, and freight movements, resulting in my domain knowledge regarding international trade.

But there is more than simply being the Master of One’s Domain to be a solid researcher. One has to know how domain knowledge can shape a research question.

Let’s look at this exchange from “Monty Python and the Holy Grail “, where the troll asks three questions. One of the questions is fairly complicated. The King asks for clarification, based on the domain knowledge gained earlier in the film from two soldiers who possess the specialized knowledge of swallows.

The question concerning the average airspeed velocity of an unladen swallow may only interest researchers examining the physics of avian flight (or Monty Python fans here and here). But having learned something about swallows earlier, the King knew enough about the domain to ask for clarification (in this case, to delay), by asking about another data attribute.

Regarding the query, the question of the average airspeed reflects a question concerning a specific data element, but the second question was based on another attribute, namely the type of swallow. For most researchers, knowing that extra bit of information may make the difference between good research or great research, or in this case, who lives or dies. So, there remains a benefit to being the domain master, as King Arthur reminded Bedevere as they cross the bridge, but only if one learns not only new data but how to apply that information.

Posted on December 21, 2018June 23, 2021

International Trade Data, Organizing Data and Client Support

On December 19, I agreed to talk at the New Orleans Data Group. The previous speakers presented work that was largely for internal audiences, so I wanted to focus on something more applied. With my interest in trade, this seemed a good fit.

Globalization refers to interconnected economies, and in a connected world, this largely is tied to investment (such as Foreign Direct Investment), Services, and Goods. (Here is a good place to start if one wants information on U.S. global activity) So, the rest of the talk focused on trade in goods.

There are many reasons why post World War II trade growth blossomed, but the economy benefited from transportation and telecommunication innovations and regulatory changes. (A good discussion of some of this was referred to in Wired magazine’s article “The 20-Ton Packet”)

But trade represents the sum of many things. For example, here are two different industries, such as toys (left) and cut flowers (left). So, there are seasonal patterns to importing merchandise, as there is just as strong seasonal exports of grains and other products. As such, trade represents the sum of decisions between many companies, (a significant amount of trade is intracompany flows).

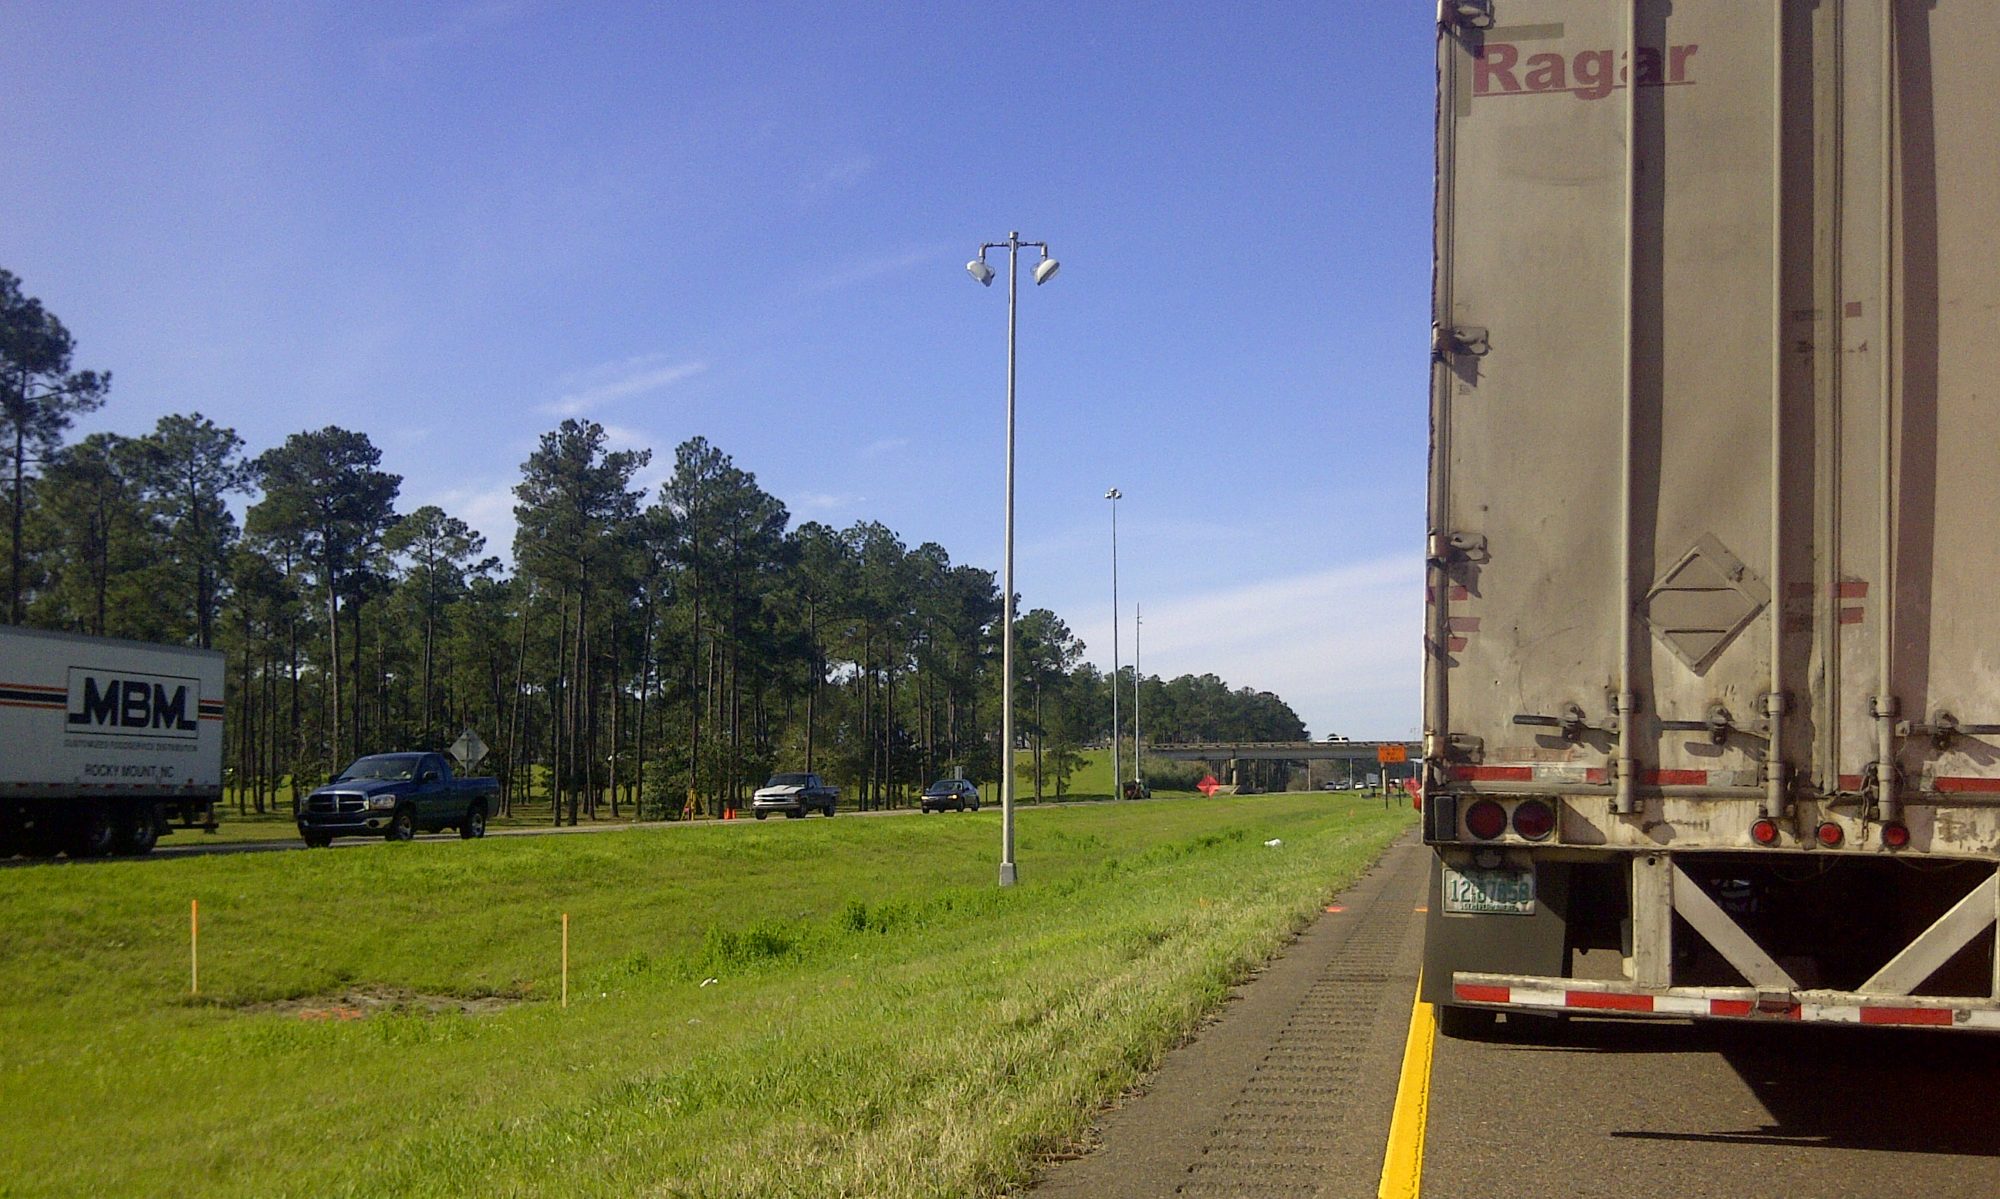
But we don’t see “TRADE”, we see transportation. Have you ever wondered what was in the truck? The picture on the right was trucks stopped in Louisiana because of a flood in 2016, but most trucks in the Southeast are moving cargo that is intrastate or internal to the Southeast. Trade, as a share of total trade, is actually only 17% of the total traffic activity. However, in Louisiana, as a very strong maritime trade, maritime trade represents a significant industry when compared to other states. (ITTS Working Paper 1 – “International Maritime Trade Benefits the Nation’s Economy“)

There are different pieces of information tied to an international shipment, such as the cargo’s origin and destination, its port of entry, and destination, duties, etc. What is not represented in the chart below is information about the shipper and receiver, the value of the cargo, who is paying for what activity (and is bearing the transportation risks) and other details. The data regarding international trade could thus represent a transaction (generated in respond to an event) or metadata, such as regarding the cargo itself, that is independent of its location and movement. (When conducting trade research, one has to remember U.S. Government disclosure rules do influence how much information can be released.)

Cargo is more likely to move via truck or air for time-sensitive shipments; on the other hand, water tends to handle large, less time-sensitive shipments with lower per unit costs. People make this trade-off. The more expensive the product, the more likely it is that air or trucking will be the
mode selected. Depending on the shipment size, people are more likely to use water, rail or pipeline for similar cargoes. As a result, people’s mode selection is based upon the value, timing, and size of the cargo.

So, there are many things related to trade. The researcher would need to know the details about season patterns, mode, etc., when organizing the data and/or query.

What was delivered…

As part of an ongoing research work, I put several databases into Tableau for the Institute for Trade and Transportation Studies member states. The effort was to develop workbooks with international trade data and other sources of information that may be of use to local planners and economists.
The video about how to engage the dashboards is here.

Working Paper 21 – “Executive Briefing Book”  (June 2018)

The following table represents the metadata regarding the data released for the states. (There are other sources of trade data not included in this study.)

The above graphic shows some metadata about the data sets I integrated into Tableau for the ITTS member states.

In reviewing the project, I talked about the need for the client to understands how to access the data and the data elements are included, so they can duplicate/review the work. I also discussed how to organize the data into Tableau, including challenges I faced regarding one to many joins and matching geography.

If you are interested in more discussions on trade data, I did a presentation at the University of Southern Mississippi regarding trade brochures developed for the ITTS member states (there are some other trade reports posted at http://www.ittsresearch.org/state-reports.html).

The real takeaway from all this…trade data is complicated, especially if one forgets the metadata, for surely the devil is in the details.

Photos I have taken over the years

Even as the floodwaters are receeding around my house, I’m still taking pictures of trucks!
lock on the Eire Canal
Shot from a van, so you can see the glare. Don’t know how many tours I have taken in a bus, van or car!
Part of Heartland Corridor tour with ITTS in 2010
Waiting for the Amtrack train to get back to Hammond

Recent Posts

  • Electric & Hybrid Marine Expo – North America
  • Spend an Afternoon in New Orleans
  • The New Year and Change
  • Bruce’s Self Defense Advice
  • Exercise Program For Seniors

Archives

  • September 2025
  • August 2023
  • December 2022
  • July 2022
  • March 2022
  • February 2022
  • January 2022
  • December 2021
  • November 2021
  • September 2021
  • August 2021
  • July 2021
  • June 2021
  • April 2021
  • February 2021
  • November 2020
  • February 2020
  • January 2020
  • October 2019
  • August 2019
  • July 2019
  • June 2019
  • May 2019
  • April 2019
  • March 2019
  • February 2019
  • December 2018
  • November 2018
  • September 2018
  • August 2018

Categories

  • academic
  • Agriculture
  • childhood
  • Client
  • commentary
  • conference
  • Culture, History and Philosophy
  • data
  • economic development
  • economics
  • future
  • humor
  • international trade
  • international trade
  • logistics
  • management
  • martial arts
  • Martial Arts
  • metadata
  • metadata
  • mobility
  • Music
  • Pandemic
  • policy
  • port
  • presentation
  • productivity
  • research
  • software
  • tableau
  • taxes
  • Technology
  • template
  • Training
  • Uncategorized

Meta

  • Log in
  • Entries feed
  • Comments feed
  • WordPress.org
Proudly powered by WordPress