A place to post my digital debris, ranging on topics ranging from writing a dissertation, economics, transportation, data/analysis, martial arts, and whatever else "floats my boat".
A few weeks ago, I made a presentation for a class at the University of New Orleans. As with a lot of my general freight speeches, I start with the following question.
For the few paying attention, most talk about water, tea, soft drinks and coffee. Eventually someone brings up beer or wine, which always gets a laugh, but the irony is most people do not think about their ability to access something safe to drink. As we have expectations regarding its cost, taste, and general characteristics, we have some general idea regarding our willingness to purchase a coke at a vending machine or a soft drink at a fast food restaurant. Oftentimes, we do not think about what it took to get that product, to that place, at that time, for you to make the purchase decision. Someone designed the bottle, made the beverage and filled the bottle, only for it to be carried to that location. It was logistics that took the beverage from the plant to where you are now.
So, as you enjoy your purchase, just stop and think that there was more to this purchase, namely that the distribution/transportation system works so well we do not marvel about drinking something that literally came from around the world, or in some magical place, as in this Coca Cola Ad.
On December 19, I agreed to talk at the New Orleans Data Group. The previous speakers presented work that was largely for internal audiences, so I wanted to focus on something more applied. With my interest in trade, this seemed a good fit.
Globalization refers to interconnected economies, and in a connected world, this largely is tied to investment (such as Foreign Direct Investment), Services, and Goods. (Here is a good place to start if one wants information on U.S. global activity) So, the rest of the talk focused on trade in goods.
There are many reasons why post World War II trade growth blossomed, but the economy benefited from transportation and telecommunication innovations and regulatory changes. (A good discussion of some of this was referred to in Wired magazine’s article “The 20-Ton Packet”)
But trade represents the sum of many things. For example, here are two different industries, such as toys (left) and cut flowers (left). So, there are seasonal patterns to importing merchandise, as there is just as strong seasonal exports of grains and other products. As such, trade represents the sum of decisions between many companies, (a significant amount of trade is intracompany flows).
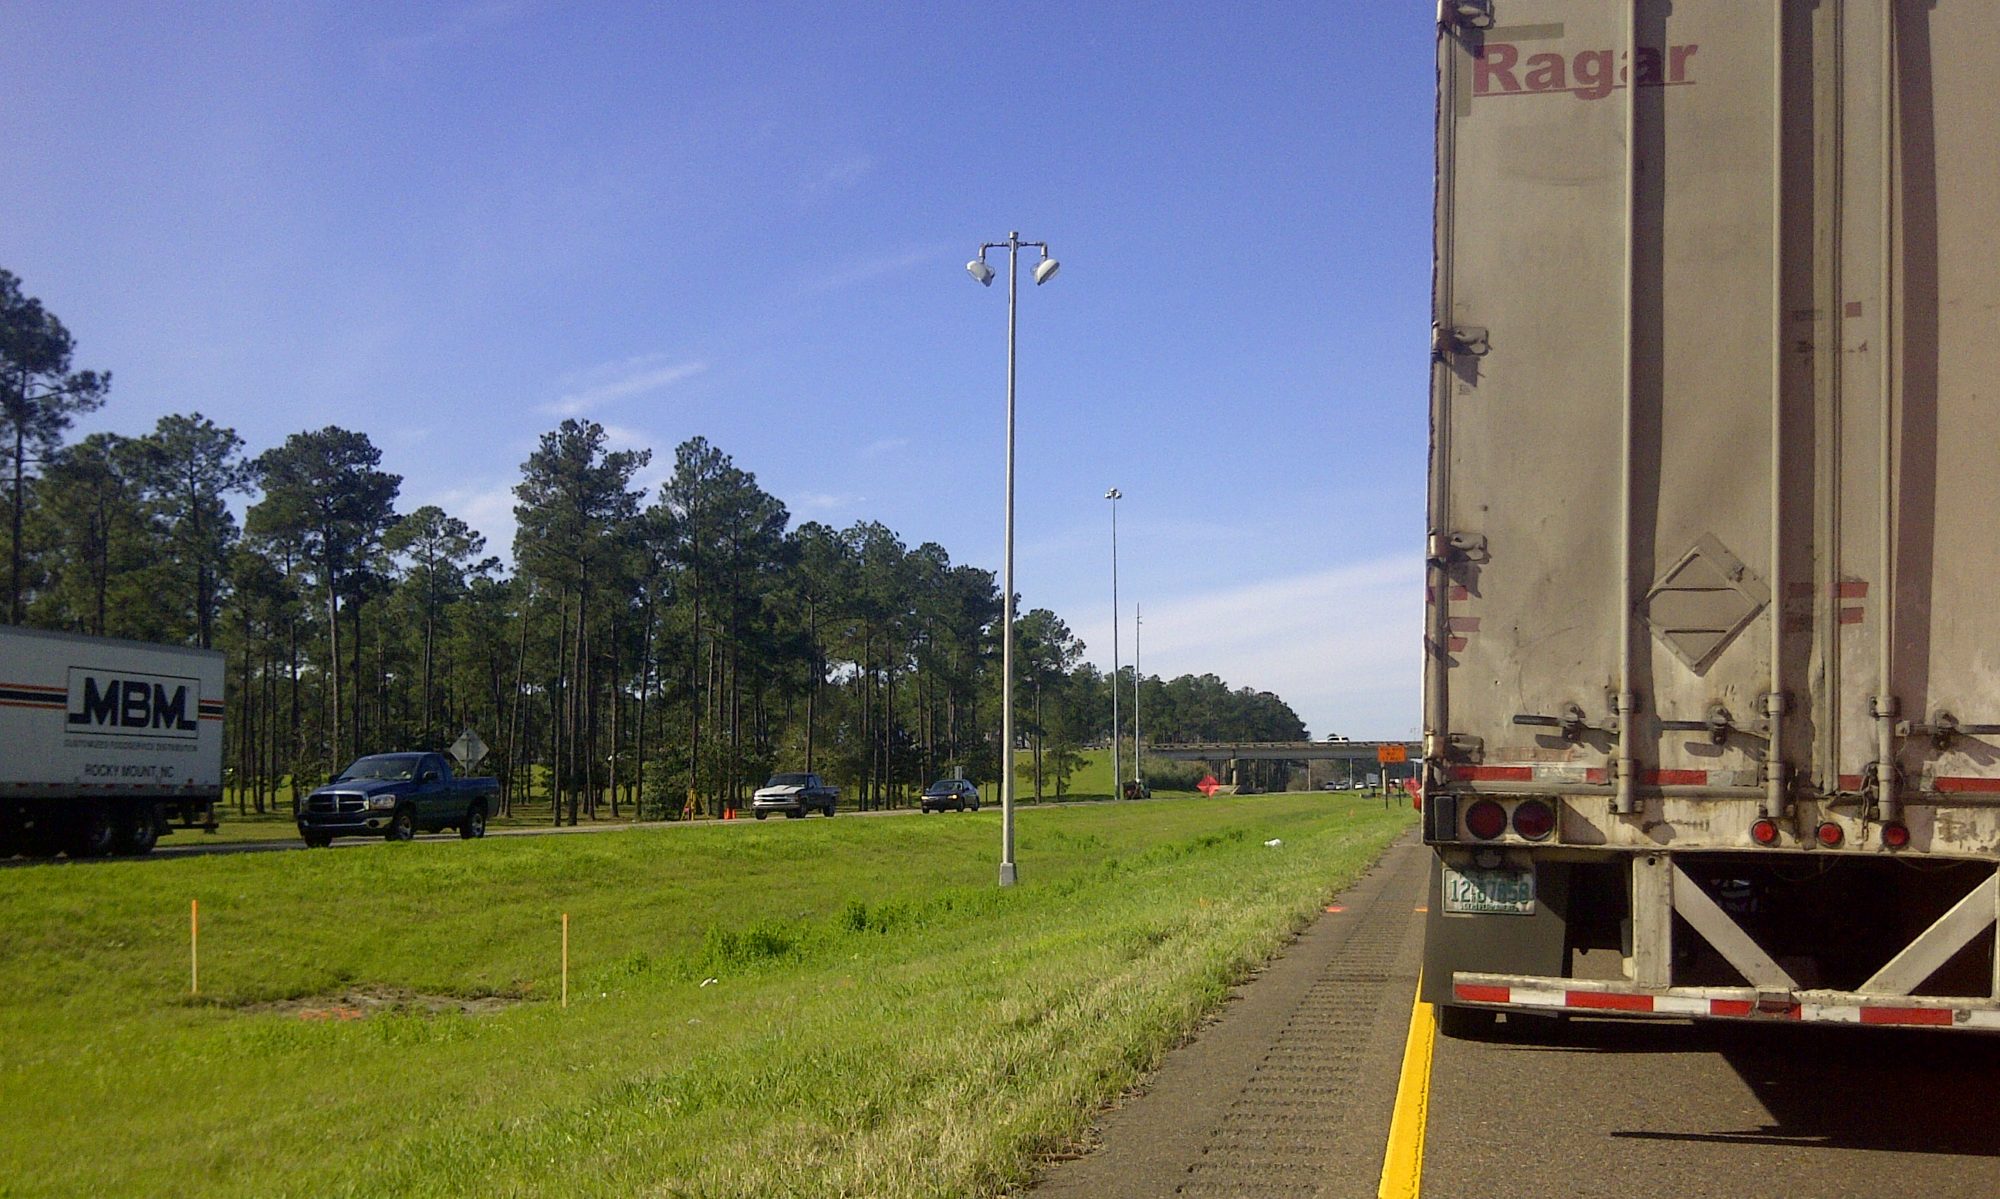
But we don’t see “TRADE”, we see transportation. Have you ever wondered what was in the truck? The picture on the right was trucks stopped in Louisiana because of a flood in 2016, but most trucks in the Southeast are moving cargo that is intrastate or internal to the Southeast. Trade, as a share of total trade, is actually only 17% of the total traffic activity. However, in Louisiana, as a very strong maritime trade, maritime trade represents a significant industry when compared to other states. (ITTS Working Paper 1 – “International Maritime Trade Benefits the Nation’s Economy“)
There are different pieces of information tied to an international shipment, such as the cargo’s origin and destination, its port of entry, and destination, duties, etc. What is not represented in the chart below is information about the shipper and receiver, the value of the cargo, who is paying for what activity (and is bearing the transportation risks) and other details. The data regarding international trade could thus represent a transaction (generated in respond to an event) or metadata, such as regarding the cargo itself, that is independent of its location and movement. (When conducting trade research, one has to remember U.S. Government disclosure rules do influence how much information can be released.)
Cargo is more likely to move via truck or air for time-sensitive shipments; on the other hand, water tends to handle large, less time-sensitive shipments with lower per unit costs. People make this trade-off. The more expensive the product, the more likely it is that air or trucking will be the mode selected. Depending on the shipment size, people are more likely to use water, rail or pipeline for similar cargoes. As a result, people’s mode selection is based upon the value, timing, and size of the cargo.
So, there are many things related to trade. The researcher would need to know the details about season patterns, mode, etc., when organizing the data and/or query.
What was delivered…
As part of an ongoing research work, I put several databases into Tableau for the Institute for Trade and Transportation Studies member states. The effort was to develop workbooks with international trade data and other sources of information that may be of use to local planners and economists. The video about how to engage the dashboards is here.
The following table represents the metadata regarding the data released for the states. (There are other sources of trade data not included in this study.)
The above graphic shows some metadata about the data sets I integrated into Tableau for the ITTS member states.
In reviewing the project, I talked about the need for the client to understands how to access the data and the data elements are included, so they can duplicate/review the work. I also discussed how to organize the data into Tableau, including challenges I faced regarding one to many joins and matching geography.
If you are interested in more discussions on trade data, I did a presentation at the University of Southern Mississippi regarding trade brochures developed for the ITTS member states (there are some other trade reports posted at http://www.ittsresearch.org/state-reports.html).
The real takeaway from all this…trade data is complicated, especially if one forgets the metadata, for surely the devil is in the details.
Based on my earlier blog post, that intelligence is the information that one uses as the basis of wisdom, I would add yet another examination of Santa and Kringle Inc’s use of big data and system processes.
So, I start with the obvious, the goal of Kringle Inc., namely, to determine what gift goes to what child in what location on a certain day. So, when Santa talks about his busy day, he is managing a lot of information so that he can manage many items, ranging from sourcing, production, trade and duties, and personnel matters, from reindeer training to elf productivity. In all cases, the clock is ticking (I wonder if Santa screams like Tom Hanks in Cast away).
We know that Santa has list concerning a child’s conditional status concerning a child’s ranking! The child, based on the behavior (crying, asleep, good, and bad), is collected from various sources, such as parents, teachers, mail, (Ray Steven’s song suggests it may borderline on obsessive). Given the times, I wonder if Santa purchases search and social media information, or aggregated email services. So, if the child passes “the Good Test”, the next item is what should a child should receive. Here Santa evaluates the child’s gift(s) based on preferences, previous year’s gifts, age, etc. In many ways, Kringle Inc. maintains several relational databases of each child’s demographic (location, age, etc. and preferences) that is joined to another database on gifts.
These gifts are then placed into a production stream, employing many elves. (Kringle Inc. successfully hires and trains workers in a rural community, and that is worth something!) The toys are loaded into the sled, and after negotiating all the appropriate tariffs and import fees, Santa is on his way. So, Kringle Inc. has to maintain inventory, customs filings, to translate the child gift to the location and delivery window. I wonder how Kringle Inc. manages to satisfy animal health codes, but that is simply a minor problem considering all the other transportation questions (hazmat cargoes) Kringle Inc. must organize in the sled’s stowing plan.
So, we have the Kringle Inc. decision tree.
But not every gift from Santa goes through this process. Sometimes Santa shows up (yes this is me in 1984) and hands out toys at a neighbor’s day care. (And only in Louisiana could a Santa Claus wear rubber boots.)
Several months ago, I approached Chip Millard about the question of freight data and geography, and so we worked together to put together this session. I hope you can register and join in!
Registration is now available for the December 19 Talking Freight Seminar.
Date/Time: December 19, 2018
1:00 – 2:30 pm ET
Topic: Using Freight Data in the Proper Geographic Contexts: Challenges and Opportunities
Description and Presentations: While freight activity utilizes a mix of different networks, from the global to the local, each movement depends on the same transportation system. In many cases, a study area’s geography may be small when compared the users on the system (a local connector study) or so broad that geography may not matter (national traffic patterns). Not all freight transportation data can be used at every geographic level; some data can only be used for macro-level geographic analyses, while other data are only appropriate to use at small-scale or micro-level geographies. For transportation agencies and companies that are interested in conducting freight transportation analyses for larger geographies, such as for an entire state or along an entire multijurisdictional corridor, or for smaller geographies, such as for a metropolitan area or county, conducting those analyses can be challenging because data may not be useful for the required level of analysis without additional, analytical rigor. There are also different of uses for freight data, ranging from simply education to project prioritization, which are not necessarily the traditional mode, commodity, and origin/destination freight data approach.
There are various transportation data sources in the public and private sector. Some of these sources are freight transportation-specific, like the Freight Analysis Framework, while others contain more general measures (demographic, economic, etc.) or geographic data (roadway networks, traffic counties, etc.) that can be adopted into a freight study. Many challenges exist when transforming data to the proper geographic scope, where the planner’s needs are aligned with the required planning needs.
This webinar will discuss how different transportation entities are examining freight transportation using geography as the research goal, and are trying to make freight data “fit into” the study area. The presenters will focus on the challenges they have faced in conducting freight analyses at both large and small-scale geographies, and provide insights concerning where data gaps exist and/or future research needs regarding program management, operations, performance metrics, or general planning needs.
Using Freight Transportation Data to Understand the Differences between Metropolitan Areas within a State
A series of presenters will provide an overview of a state DOT’s efforts to understand freight flows within their state through research programs to address freight data gaps.
SPEAKERS:
Joel Worrell, Florida Department of Transportation
Thomas Hill, Florida Department of Transportation
Holly Cohen, Florida Department of Transportation
Utilizing Freight Transportation Data to Help Prioritize Projects along Key Freight Corridors (SmartScale) and Address Truck Parking Needs
This presentation will discuss how Virginia DOT has identified large and small-scale project needs along key freight corridors within the state.
SPEAKER:
Erik Johnson, Virginia Department of Transportation
Using Freight Transportation Data to Examine Last Mile Freight Transportation Needs
This presentation will examine how freight traffic volume information can be integrated into regional and local land use planning.
SPEAKERS:
Michael Brown, Metro Analytics
Chandler Duncan, Metro Analytics
If you have not yet participated in Talking Freight, I encourage you to do so. These monthly seminars, sponsored by the Federal Highway Administration, are held via web conference, which means that you view the PowerPoint presentations over the Internet while listening to the presenters over your computer or the telephone. There is no cost involved and you do not have to leave your desk to participate. More information about Talking Freight is available at http://www.ops.fhwa.dot.gov/freight/fpd/talking_freight/index.htm Links to past presentations and recordings are available on http://www.fhwa.dot.gov/freightplanning/talking.htm.
When I was younger I read the story of the three vinegar tasters in “The Tao of Pooh“. What does vinegar taste like maybe a question for a cooking class, but as a researcher, its relevance is more important as “why do people need this information”. Everyone who is asking a question does so for many reasons, but they can be grouped into some very large clusters:
information to impress (everyone wants HUGE numbers),
wisdom to inform a decision maker (help make a decision), or
to satisfy a program requirement (support a decision already made).
As a researcher, people come and ask you for a question to be answered. The challenge is you may have to help them ask the correct question, which sometimes they may not understand why formulating their request remains a critical step for a successful study. In the short story, “Ask A Foolish Question”, by Robert Sheckley, there is a machine capable of answering any question, named the “Answerer”. The problem is that people asking do not know as much as the computer (or in some cases, the researcher’s knowledge on the topic). The Questioner must know something about the answer for the Answerer to provide the correct information. In some ways, every researcher must learn how to pass on information, but they must also inform the people asking the question to help them both format their question and understand the answer. (Richard Feynmn would argue if you can’t explain it to a five-year old, do you really understand the topic?) Sometimes people feel like Ralph where there is too much ambiguity to even phrase the question.
In helping people frame their research, often we simply have to listen, asking them what they want and how will they use the information. Oftentimes this becomes a collaborative process between the answerer and the asker.
With the advent of the internet, many assume the information they seek is readily available, often ignoring the work and effort it takes to transform data into something useful, This failure to understand could lead to the discounting of the work associated with exploring the question, assisting in organizing the research, and providing a satisfying answer. So, please a little patience goes a long way for everyone to agree on how vinegar should taste.
The Ancient Mariner could have as easily said “Data, Data, everywhere”, as discussions regarding big data and other analytical approaches seem to be the order of the day Wall Street Journal. We often make data out to be this mysterious element, but data requires context to be useful to anyone if they intend to make a decision, as I hope to show below. For example, data becomes information when it is categorized, which then becomes intelligence when a decision can be made, and ultimately wisdom when an action occurs based on intelligence.
One of my favorite quotes about Coffee comes from Charles Maurice de Talleyrand-Périgor, who said that the perfect cup of coffee should be: “Black as the devil, hot as hell, pure as an angel, sweet as love.” I would agree that a good cup of coffee is a bargain at any price, so let’s think about how the decision to buy a cup of coffee can explain transforming data into wisdom.
The objective: I would like to purchase a cup of coffee at Giddyup Coffee in Folsom, LA. So, I asked the two baristas if I could do take a few pictures for this blog post. They thought it funny that someone would actually do this, but they agreed. So, the research question is: do I have enough loose change to purchase a cup of coffee.
Data:
Loose Coins – represent Data
There will be a cost of purchasing a cup of coffee, so I look into my coin purse. These loose coins are simply data points, each representing a certain value. (Coins contain other information, such as their size, year and place it was minted, as well as the coins condition based on circulation. These data points are not relevant for this purpose are ignored.) However, beyond knowing that I have coins, I do not know if these coins are enough to purchase a cup of coffee.
Information: The loose coins now need to be organized before I can actually make a decision, so the coins were put into different categories. This act of putting the coins into categories, based on the relative value of the coins, resulted in the data about the coins becoming information.
Data becomes Information
Intelligence: Now that I know the relative value of the coins, I next have to make a comparison. Do I have enough to actually purchase the coffee with the coins that I have? So, I add a new data element, namely the posted value of a cup of coffee. So, the addition of the information posted on the menu allowed me to determine if I could make a purchase with my loose change.
Wisdom: I bought the cup of coffee, once I had enough intelligence to make a decision based on the cost of the cup of coffee and my loose change. (Wisdom is the only attribute with a future component, namely, data, information, intelligence are all static elements at the moment a decision is made, but Wisdom will influence my future actions.)
I learned this paradigm as the more formal DIKW: Data, Information, Knowledge, Wisdom. While one could argue that the DIKW is based upon filtering data to make a decision, I changed Knowledge into Intelligence. I see Knowledge represents a broad body of information, based on many factors, including not only the data itself but the cultural, contextual relationship of the researcher to the topic being researched. For example, I could have taken the coins to a Coinstar or a bank, or made a different decision concerning these coins. For my father who abhors coffee (his loss), the research question (can I purchase a cup of coffee) would mean nothing to him, (much like saying “what does that have to do with the price of tea in China?”!) For me, knowledge serves not as a filter of the data/information as normally discussed in the DIKW paradigm, but rather a filter through the act of transforming data to wisdom can even occur.
Finally, we can not remove the researcher from the research, but a good researcher should understand what data elements are useful to become transformed into intelligence based on understanding what answer is required.
On Tuesday, October 30, I had the privilege of attending/presenting at the 2018 Mississippi Transportation Institute Conference. There were many great speakers, including a thoughtful Tim Flick, who spoke on leadership, and the energetic Janie Waters, who discussed change while leading everyone in the Hokie Pokie. With so many quality presentations, I was honored to have been invited to speak, much less during lunch. After being introduced by Northern District Commissioner Mike Taggert (in my opinion, a great asset for the State of Mississippi), I presented the following presentation. ( my presentation: lambert-MTI 2018)
Defined transportation as a benefit:
to passengers and users,
to support the economy through freight movements,
to other sectors in the Mississippi economy.
Often, these benefits are not linked to the role that the transportation system serves an integral part of the state’s commitment to its citizens. The average citizen benefits from a robust highway system, as transportation makes our modern life accessible, but the system does have a direct cost, such as through taxes, or indirect costs, such as closed bridges, vehicle damage, etc., to the citizens of Mississippi.
Here are some of the references I used in preparing my remarks:
1987 was the last concerted effort in Mississippi for a comprehensive statewide highway network program, which was the same year I graduated from Louisiana State University. Since that was also the last year the State raised the gas tax, I am paying the State of Mississippi the same per gallon of gas from when I drove across the state after my graduation in 1987 as I did this week when I purchased gas to drive to the conference.
The problem is not one of identifying projects, but in securing funding for these projects, While the state has recently taken steps to address this need, it took shutting down bridges to get some attention on this issue. Maybe the citizens of Mississippi just need to eat more Domino’s Pizzas to fix the state’s potholes!
Superman is arguing that he does not want to pay taxes for roads since he flies everywhere! (I think he probably filed under Clark Kent, but that is another story.) Superman’s complaint is that he should only pay for what he uses reflects the question of public sector spending and how that ties into each individual person uses/requirements. (In fact, the gas tax is indirectly based on usage- you drive more, you pay more tax- here is a good discussion on the history of the gas/fuel tax.)
While most spending on highway infrastructure is funded by the Federal Gas tax, there are funds (such as from the general revenue) that support infrastructure investment. (Missouri did a good citizen’s guide to transportation that is worth a look-http://www2.modot.org/guidetotransportation/!, as well as a New York Times editorial on New Jersey’s gas tax and the associated comments https://www.nytimes.com/2016/01/16/opinion/states-should-raise-the-gas-tax.html) While gas taxes cover other activities, such as the gas tax pays for transit programs, there remain expectations that a consistent system lies outside one’s front door.
Everyone requires different transportation needs, based on location, access, but even driver patterns change over a lifetime (https://www.fhwa.dot.gov/ohim/onh00/bar8.htm) Like all taxes, the linkage between transportation taxes and investment is not equitable, not is there any way to really make such taxes neutral to all parties. Although Superman can fly, he needs access to goods and other services. (I wonder if Batman pays fuel taxes for the Batmobile.) Someone made Superman’s costume (Edna Mode, or maybe he bought it online!) As such, Superman enjoys the benefits of public investment in infrastructure, even if he does not drive, and thus does not pay any fuel taxes.
As I was putting together a sample market study for Scott County Missouri for the ITTS member states (Working Paper 13), there is a lot of information regarding transportation, economic activity, and a host of elements concerning sources of additional economic data, especially when combined with the Executive Briefing Book (Working Paper 21). However, know this source data does not necessarily mean this information will generate additional economic growth independent of some active leadership. That question could be summarized as “how do I tell a story that is actionable”.
After writing those reports, I realized that there are two stages to this quest to attract and retain economic development – I call the first step “the Dream”, where a vision is created and sold to regional and potential partners, while there is a second stage I call “the How”. This is the actionable part of economic development, where leadership and commitment are necessary to move a project forward.
The dream…
Elevate your branding
Zero in on potential customers
Reach consensus with local partners
Aggressively identify competitive assets attractive to all parties
The how..
Pursue realistic timelines
Outline budgetary and regulatory approval needs as early as possible
Understand your competitor’s capabilities
Negotiate project review checkpoints
Deploy resources until completed
(And yes, the acrostic is a poet’s name. I love playing with the Acrostic word games. One of his most famous poems is an impression of a metro station – another transportation angle!)
Hello and welcome to my little slice of the internet.
When I was growing becoming a transportation econoimst was the farthest thing from my mind, but such is life!
This website is more for me to focus/share my thoughts on trade and transportation topics, from planning to policy to economic and data analysis, into a single place, but I hope you enjoy the ride.
Even as the floodwaters in 2016 were receeding around my house, I’m still taking pictures of trucks! I know, its a sickness 🙂