On December 19, I agreed to talk at the New Orleans Data Group. The previous speakers presented work that was largely for internal audiences, so I wanted to focus on something more applied. With my interest in trade, this seemed a good fit.
Globalization refers to interconnected economies, and in a connected world, this largely is tied to investment (such as Foreign Direct Investment), Services, and Goods. (Here is a good place to start if one wants information on U.S. global activity) So, the rest of the talk focused on trade in goods.

There are many reasons why post World War II trade growth blossomed, but the economy benefited from transportation and telecommunication innovations and regulatory changes. (A good discussion of some of this was referred to in Wired magazine’s article “The 20-Ton Packet”)

But trade represents the sum of many things. For example, here are two different industries, such as toys (left) and cut flowers (left). So, there are seasonal patterns to importing merchandise, as there is just as strong seasonal exports of grains and other products. As such, trade represents the sum of decisions between many companies, (a significant amount of trade is intracompany flows).
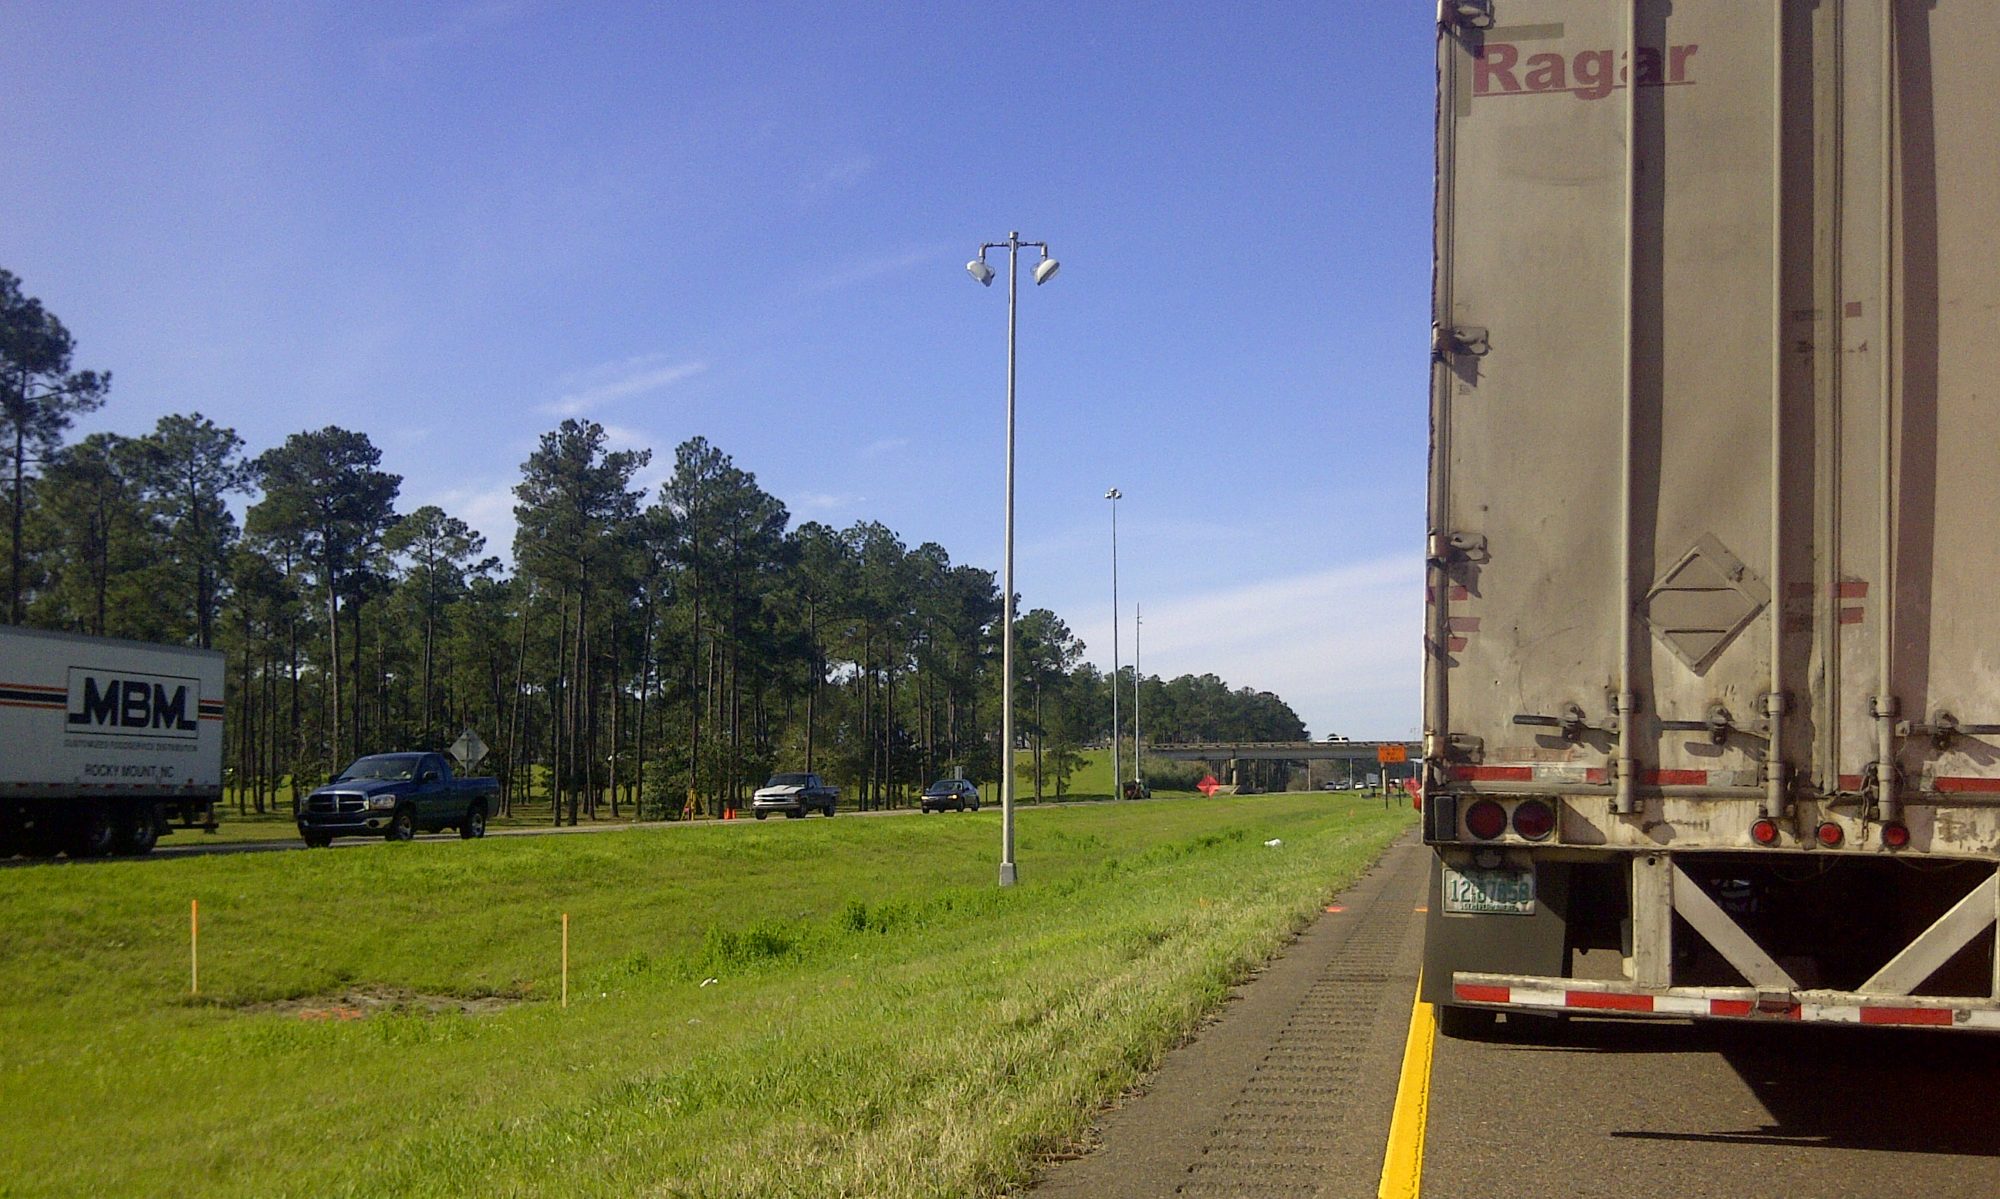
But we don’t see “TRADE”, we see transportation. Have you ever wondered what was in the truck? The picture on the right was trucks stopped in Louisiana because of a flood in 2016, but most trucks in the Southeast are moving cargo that is intrastate or internal to the Southeast. Trade, as a share of total trade, is actually only 17% of the total traffic activity. However, in Louisiana, as a very strong maritime trade, maritime trade represents a significant industry when compared to other states. (ITTS Working Paper 1 – “International Maritime Trade Benefits the Nation’s Economy“)
There are different pieces of information tied to an international shipment, such as the cargo’s origin and destination, its port of entry, and destination, duties, etc. What is not represented in the chart below is information about the shipper and receiver, the value of the cargo, who is paying for what activity (and is bearing the transportation risks) and other details. The data regarding international trade could thus represent a transaction (generated in respond to an event) or metadata, such as regarding the cargo itself, that is independent of its location and movement. (When conducting trade research, one has to remember U.S. Government disclosure rules do influence how much information can be released.)

Cargo is more likely to move via truck or air for time-sensitive shipments; on the other hand, water tends to handle large, less time-sensitive shipments with lower per unit costs. People make this trade-off. The more expensive the product, the more likely it is that air or trucking will be the
mode selected. Depending on the shipment size, people are more likely to use water, rail or pipeline for similar cargoes. As a result, people’s mode selection is based upon the value, timing, and size of the cargo.

So, there are many things related to trade. The researcher would need to know the details about season patterns, mode, etc., when organizing the data and/or query.

What was delivered…
As part of an ongoing research work, I put several databases into Tableau for the Institute for Trade and Transportation Studies member states. The effort was to develop workbooks with international trade data and other sources of information that may be of use to local planners and economists.
The video about how to engage the dashboards is here.
Working Paper 21 – “Executive Briefing Book” (June 2018)
The following table represents the metadata regarding the data released for the states. (There are other sources of trade data not included in this study.)

In reviewing the project, I talked about the need for the client to understands how to access the data and the data elements are included, so they can duplicate/review the work. I also discussed how to organize the data into Tableau, including challenges I faced regarding one to many joins and matching geography.
If you are interested in more discussions on trade data, I did a presentation at the University of Southern Mississippi regarding trade brochures developed for the ITTS member states (there are some other trade reports posted at http://www.ittsresearch.org/state-reports.html).
The real takeaway from all this…trade data is complicated, especially if one forgets the metadata, for surely the devil is in the details.


